

 |
01905 795005 |
Our Smart Carbon Report
Carbon footprint report for Nomeq Ltd
01 January 2024 to 31 December 2024
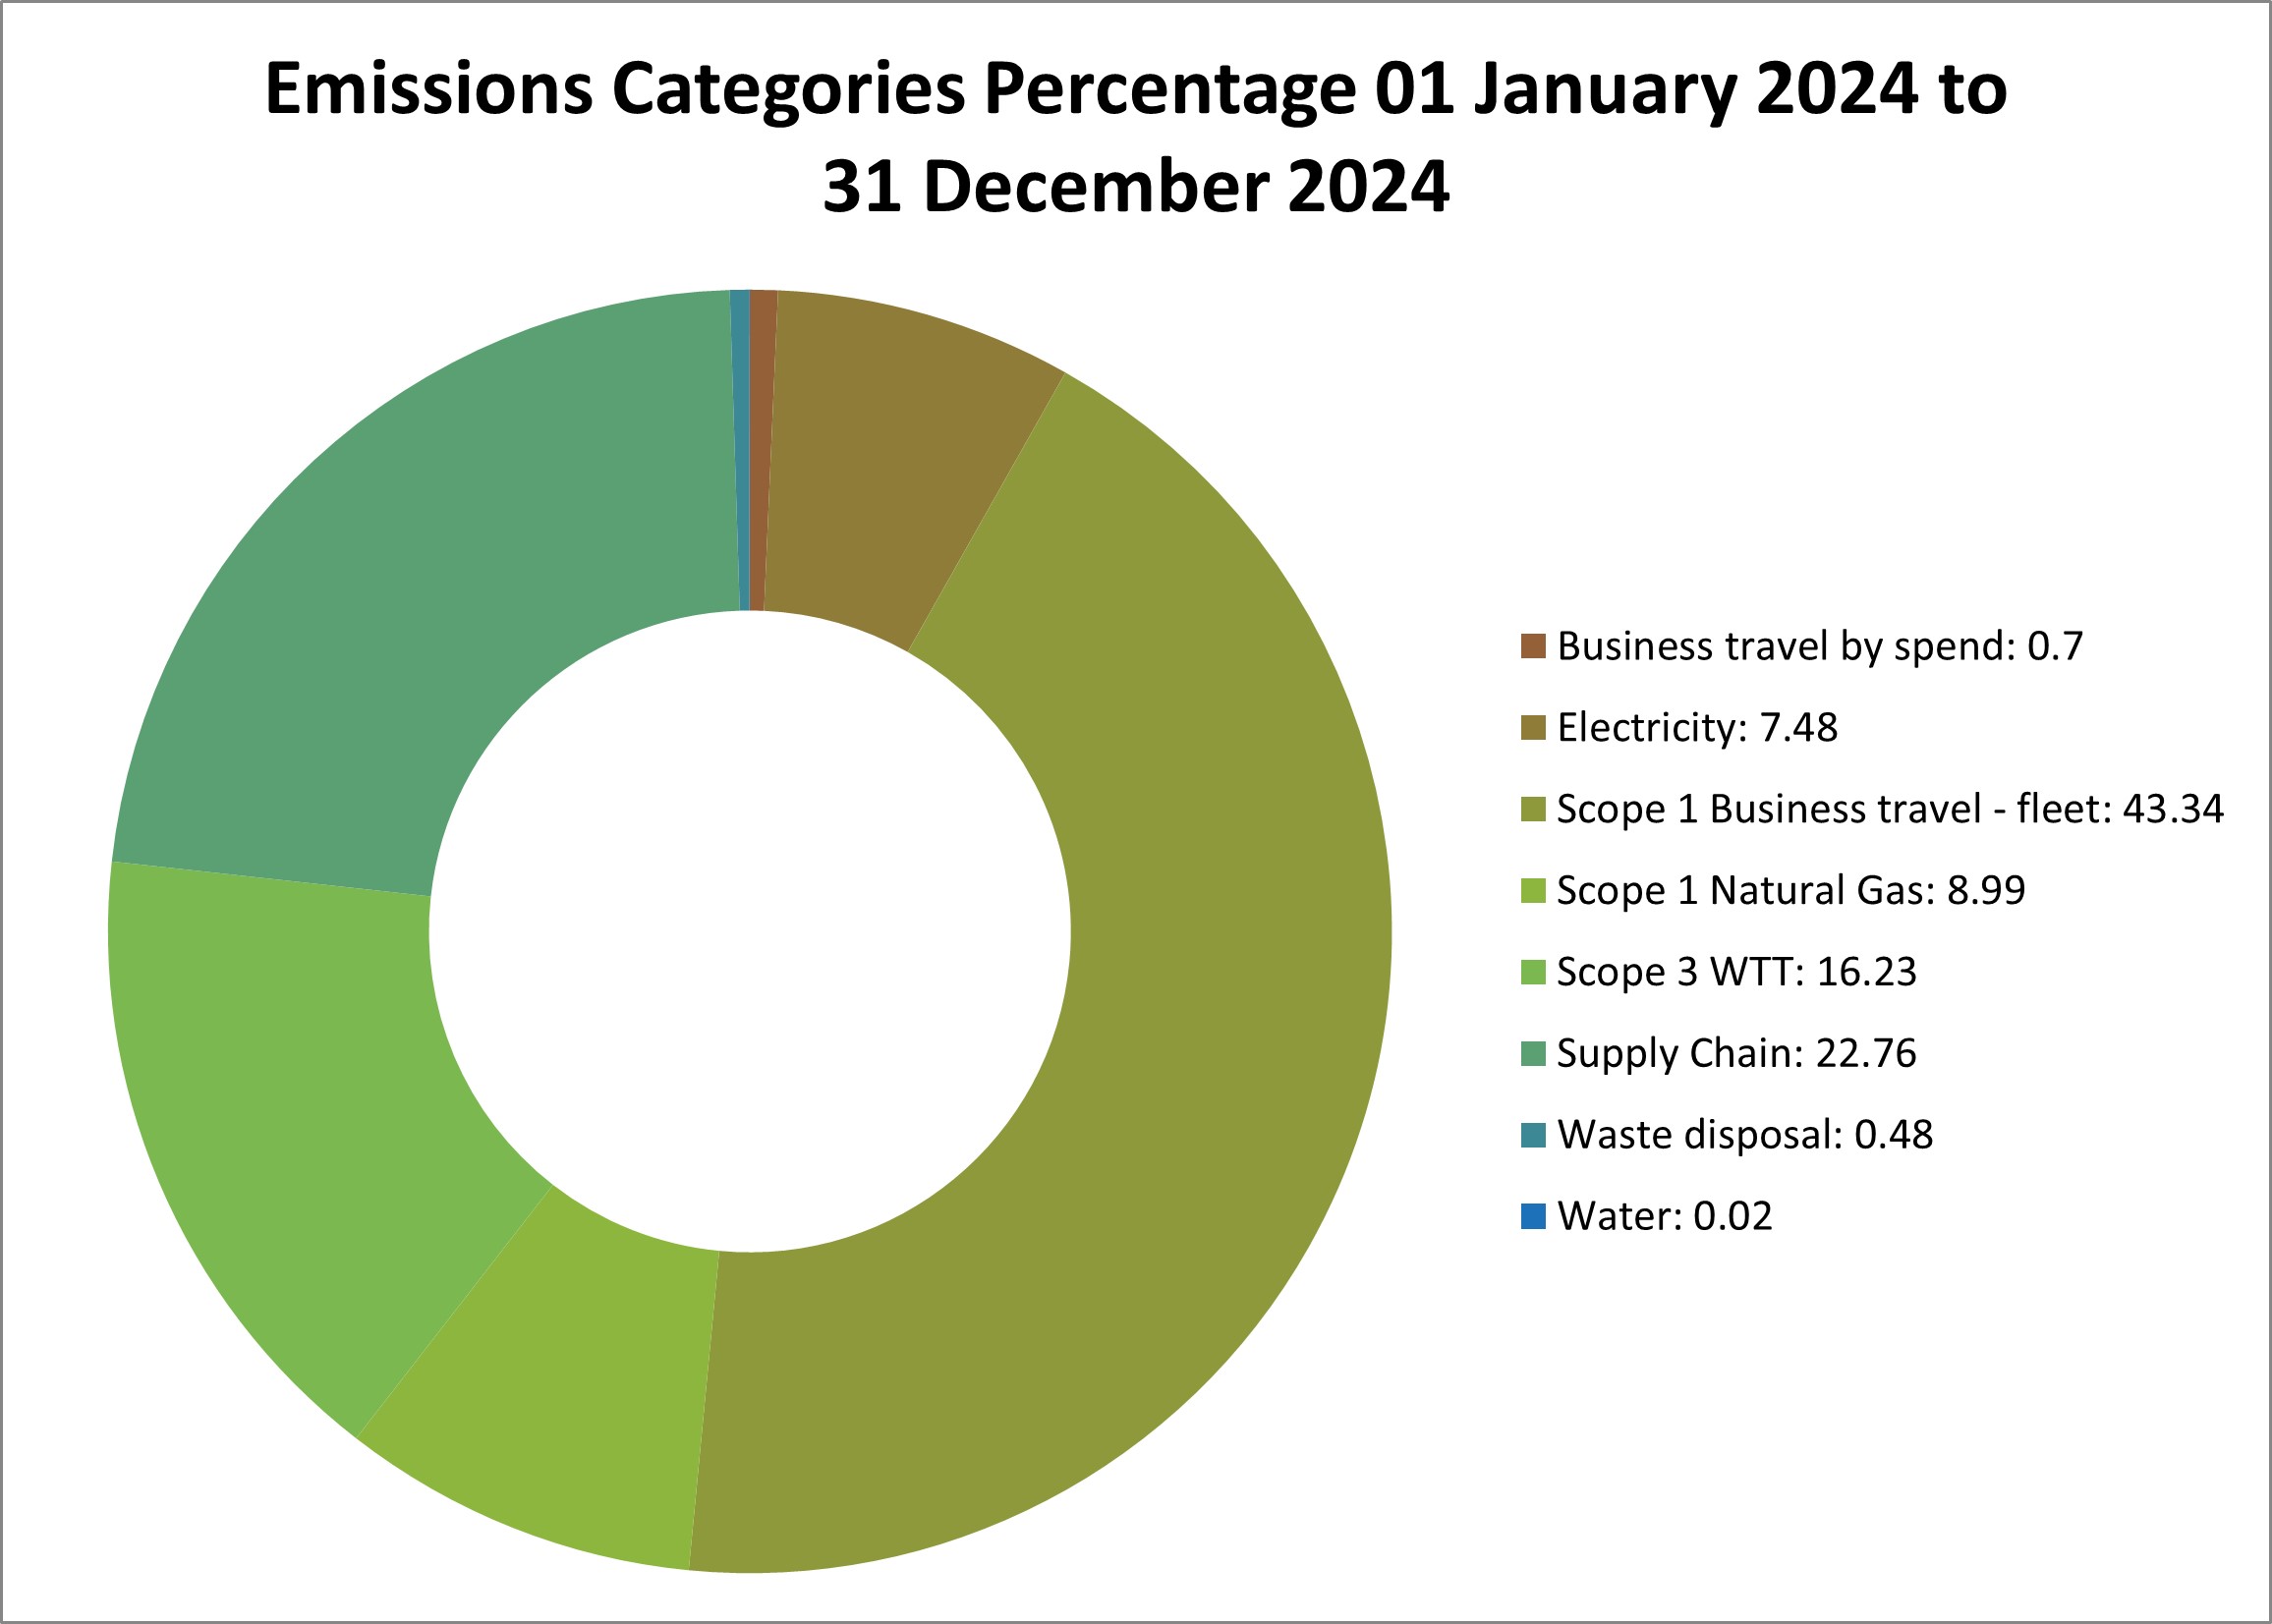
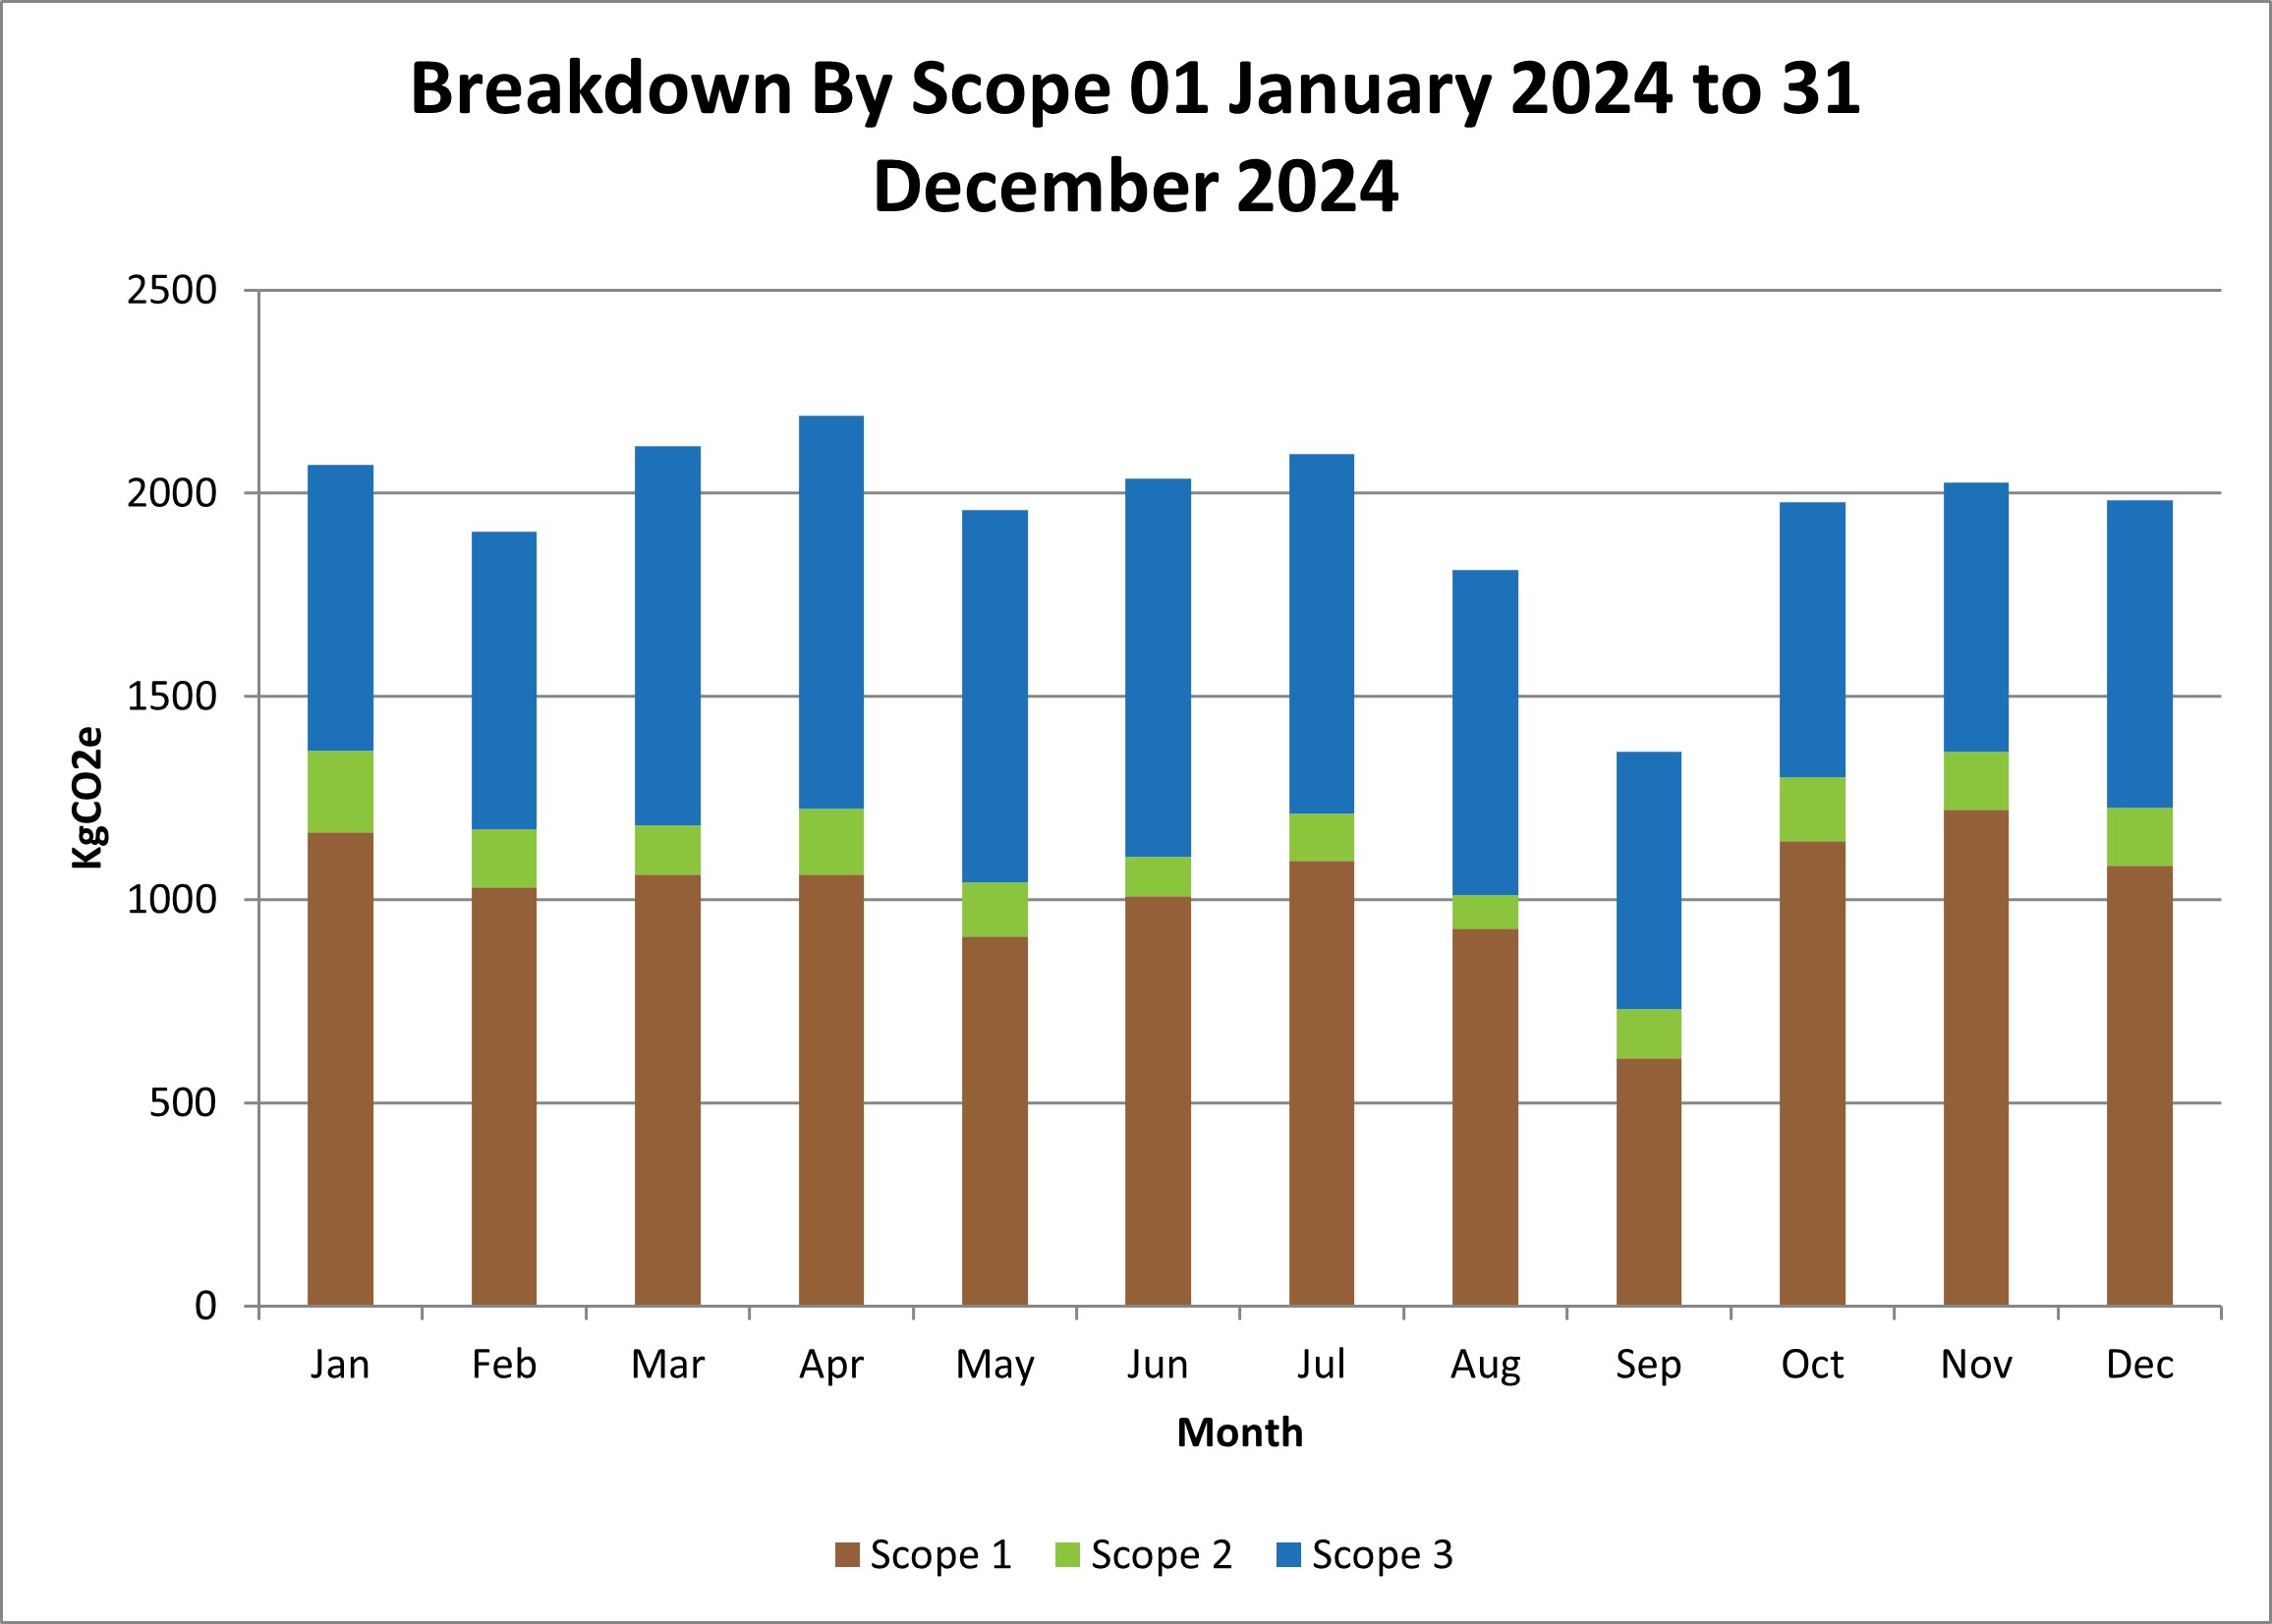
Nomeq Ltd emitted 13,935 kgCO2e (Kilogrammes of carbon dioxide equivalent) for 2024 (across scope 1 and 2). This can be presented as 14 tCO2e (tonnes of carbon dioxide equivalent) with an intensity indicator of 2.79 tCO2e per total full-time equivalent employee (FTE) and 30.40 tCO2e per million GBP £.
When Scope 3 is added, this brings the total to 24 tCO2e.
Table 1. UK GHG emissions and energy use data for period 01 January 2024 to 31 December 2024
|
Units |
kWh |
Carbon (kgCO2e) |
Carbon (tCO2e) |
|
|
Scope 1 |
||||
|
Medium car (Plug-in hybrid) |
63,648 km |
22,238 |
5,168.21 |
5.17 |
|
Medium car (hybrid) |
31,619 km |
14,913 |
3,633.00 |
3.63 |
|
Large car (diesel) |
6,752 km |
5,538 |
1,399.63 |
1.40 |
|
Natural gas |
11,575 kWh |
11,575 |
2,117.07 |
2.12 |
|
Total Scope 1 |
12,318 |
12 |
||
|
Scope 2 |
||||
|
UK National Grid electricity |
7,812 kWh |
7,812 |
1,617.47 |
1.62 |
|
Total Scope 1 & 2 |
13,935 |
14 |
||
|
2.79 |
||||
|
Total tCO2e per *£m Turnover on gross scope 1 & 2 |
30.40 |
|||
|
Emissions source |
Units |
kWh |
Carbon (kgCO2e) |
Carbon (tCO2e) |
|
Scope 3 |
||||
|
Cat 01 - Purchased Goods & Services |
||||
|
By spend - By SIC emissions intensity - I - Accommodation and food services |
£13,729 |
|
878.98 |
0.88 |
|
By spend - By SIC emissions intensity - J - Information and communication |
£14,586 |
|
0.00 |
0.00 |
|
By spend - By SIC emissions intensity - K - Financial and insurance activities |
£18,015 |
|
0.00 |
0.00 |
|
By spend - By SIC emissions intensity - N - Administrative and support service activities |
£5,386 |
|
147.79 |
0.15 |
|
Material use (BEIS) - Water consumption - Water supply |
12 m3 |
|
1.84 |
0.00 |
|
Supply Chain Dashboard |
|
|
0 |
0 |
|
Cat 03 - Fuel & energy related activities |
||||
|
Transmission & distribution losses - T&D for UK national grid electricity |
7,812 kWh |
|
142.96 |
0.14 |
|
Well-to-tank (WTT) - Business travel - Passenger Vehicles - WTT - Diesel - Large car |
4,196 mile |
|
342.33 |
0.34 |
|
Well-to-tank (WTT) - Business travel - Passenger Vehicles - WTT - Hybrid - Medium car |
19,647 mile |
|
947.93 |
0.95 |
|
Well-to-tank (WTT) - Business travel - Passenger Vehicles - WTT - Plug-in Hybrid Electric Vehicle - Medium car |
41,296 mile |
|
1,677.44 |
1.68 |
|
Well-to-tank (WTT) - Electricity - WTT- UK electricity (generation) |
10,061 kWh |
|
461.78 |
0.46 |
|
Well-to-tank (WTT) - Electricity - WTT- UK electricity (T&D) |
10,061 kWh |
|
39.94 |
0.04 |
|
Well-to-tank (WTT) - Fuels - WTT - Natural Gas (kWh) |
11,575 kWh |
|
349.68 |
0.35 |
|
Cat 04 - Upstream transportation & distribution |
||||
|
By spend - H - Transport and storage |
£4,012 |
|
4,329.61 |
4.33 |
|
Cat 05 - Waste disposal |
||||
|
Batteries (Open-loop) |
11 kg |
|
0.07 |
0.00 |
|
Commercial and industrial waste (Landfill) |
217 kg |
|
112.70 |
0.11 |
|
Glass (Closed-loop) |
1 kg |
|
0.01 |
0.00 |
|
Metal: mixed cans (Closed-loop) |
6 kg |
|
0.03 |
0.00 |
|
Paper and board: board (Closed-loop) |
40 kg |
|
0.25 |
0.00 |
|
Paper and board: paper (Closed-loop) |
61 kg |
|
0.39 |
0.00 |
|
Plastics: average plastics (Open-loop) |
13 kg |
|
0.08 |
0.00 |
|
Water discharge - Water treatment |
11 m3 |
|
2.12 |
0.00 |
|
WEEE - mixed (Open-loop) |
55 kg |
|
0.35 |
0.00 |
|
Cat 06 - Business Travel |
||||
|
By spend - By SIC emissions intensity - Travel - Rail Travel (H - Rail transport) |
£301 |
|
165.24 |
0.17 |
|
Total Scope 3 |
9,602 |
10 |
||
|
Total Scope 1, 2 & 3 |
23,537 |
24 |
||
|
TotaltCO2e per*FTE on gross scope 1, 2 & 3 |
4.71 |
|||
|
TotaltCO2e per*£m Turnover on gross scope 1, 2 & 3 |
51.35 |
|||
|
Adjustments |
*Notes: For 01 January 2024 to 31 December 2024 the number ofFull-time equivalent employees (FTE) was 5 and the Turnover was GBP £458,333
Energy efficiency measures taken
- Nomeq Ltdhas continued to replace existing lighting with energy efficient LED lights. Only when the existing lighting fails to ensure unnecessary early contribution to Scope 3 emissions and landfill.
- Replaced another hybrid vehicle with a plug in hybrid vehicle
- Increased the recycling of waste. Increased the re-use of packaging and lowered the amount of landfill.
Energy efficiency planned
Nomeq Ltdplans to replace the plug in hybrid vehicles with full electric vehicles once the national infrastructure coverage is in place to ensure viability.
Encourage and support further working from home to reduce vehicle travel.
Re-consider moving to a green electricity tariff.
Investigate the option of further use of the rail network.
Notes about methodology:
- Nomeq Ltd has adopted an operational control approach to establishing the boundary. The methodology adopted in line with the Greenhouse Gas Protocol1 and the BEIS Environmental Reporting Guidelines2. The calculations were completed on the SmartCarbonTM Calculator3 using the UK Government emissions factors4.
- CO2e is the universal unit of measurement to indicate the global warming potential (GWP) of Greenhouse Gases (GHGs), expressed in terms of the GWP of one unit of carbon dioxide. There are seven main GHGs that contribute to climate change, as covered by the Kyoto Protocol: carbon dioxide (CO2), methane (CH4), nitrous oxide (N2O), hydrofluorocarbons (HFCs), perfluorocarbons (PFCs), sulphur hexafluoride (SF6) and nitrogen trifluoride (NF3). Different activities emit different gases. Using CO₂e allows all greenhouse gases to be measured on a like-for-like basis.
- For National grid electricity consumption, THE ORGANISATION has included factors for the transmission and distribution of electricity (T&D) losses, which occur between the power station and site(s). The emissions from T&D has been accounted for in Scope 3. As with other Scope 3 impacts, reporting T&D is voluntary but is recommended standard practice by UK Government2.
Estimations:
- In order to continue our progress to achieving Net Zero by 2040, we have adopted the following carbon reduction targets. We project that carbon emissions will decrease over the next 5 years to 17.30 tCO2e by 2030. This is a reduction of 25%.
Definitions:
Carbon footprint - The total set of greenhouse gas emissions (GHG) caused directly and indirectly by an individual event, organisation, or product expressed as Carbon Dioxide Equivalent (CO2e). (Source: Greenhouse Gas Protocol).
Scope 1 (direct emissions) emissions are those from activities owned or controlled by your organisation. Examples of Scope 1 emissions include emissions from combustion in owned or controlled boilers, furnaces and vehicles; and emissions from chemical production in owned or controlled process equipment.
Scope 2 (energy indirect) emissions are those released into the atmosphere that are associated with your consumption of purchased electricity, heat, steam and cooling. These indirect emissions are a consequence of your organisation’s energy use, but occur at sources you do not own or control.
Scope 3 (other indirect) emissions are a consequence of your actions that occur at sources you do not own or control and are not classed as Scope 2 emissions. Examples of Scope 3 emissions are business travel by means not owned or controlled by your organisation, waste disposal, materials or fuels your organisation purchases. Deciding if emissions from a vehicle, office or factory that you use are Scope 1 or Scope 3 may depend on how you define your operational boundaries. Scope 3 emissions can be from activities that are upstream or downstream of your organisation. More information on Scope 3 and other aspects of reporting can be found in the Greenhouse Gas Protocol Corporate Standard.
References:
- The GHG Protocol Corporate Accounting and Reporting Standard. Revised Edition (2015) World Resource Institute and World Business Council for Sustainable Development.
- Environmental Reporting Guidelines: Including streamlined energy and carbon reporting guidance (March 2019) UK Government Department for Business, Environment and Industrial Strategy.
- SmartCarbon Calculator: https://www.smartcarboncalculator.com/
- Greenhouse gas reporting: conversion factors - Full set (for advanced users). More at this link:
https://www.gov.uk/government/collections/government-conversion-factors-for-company-reporting


 Share on Facebook
 Twitter
 Tumblr
 LinkedIn
